

Insurance Claims Analysis
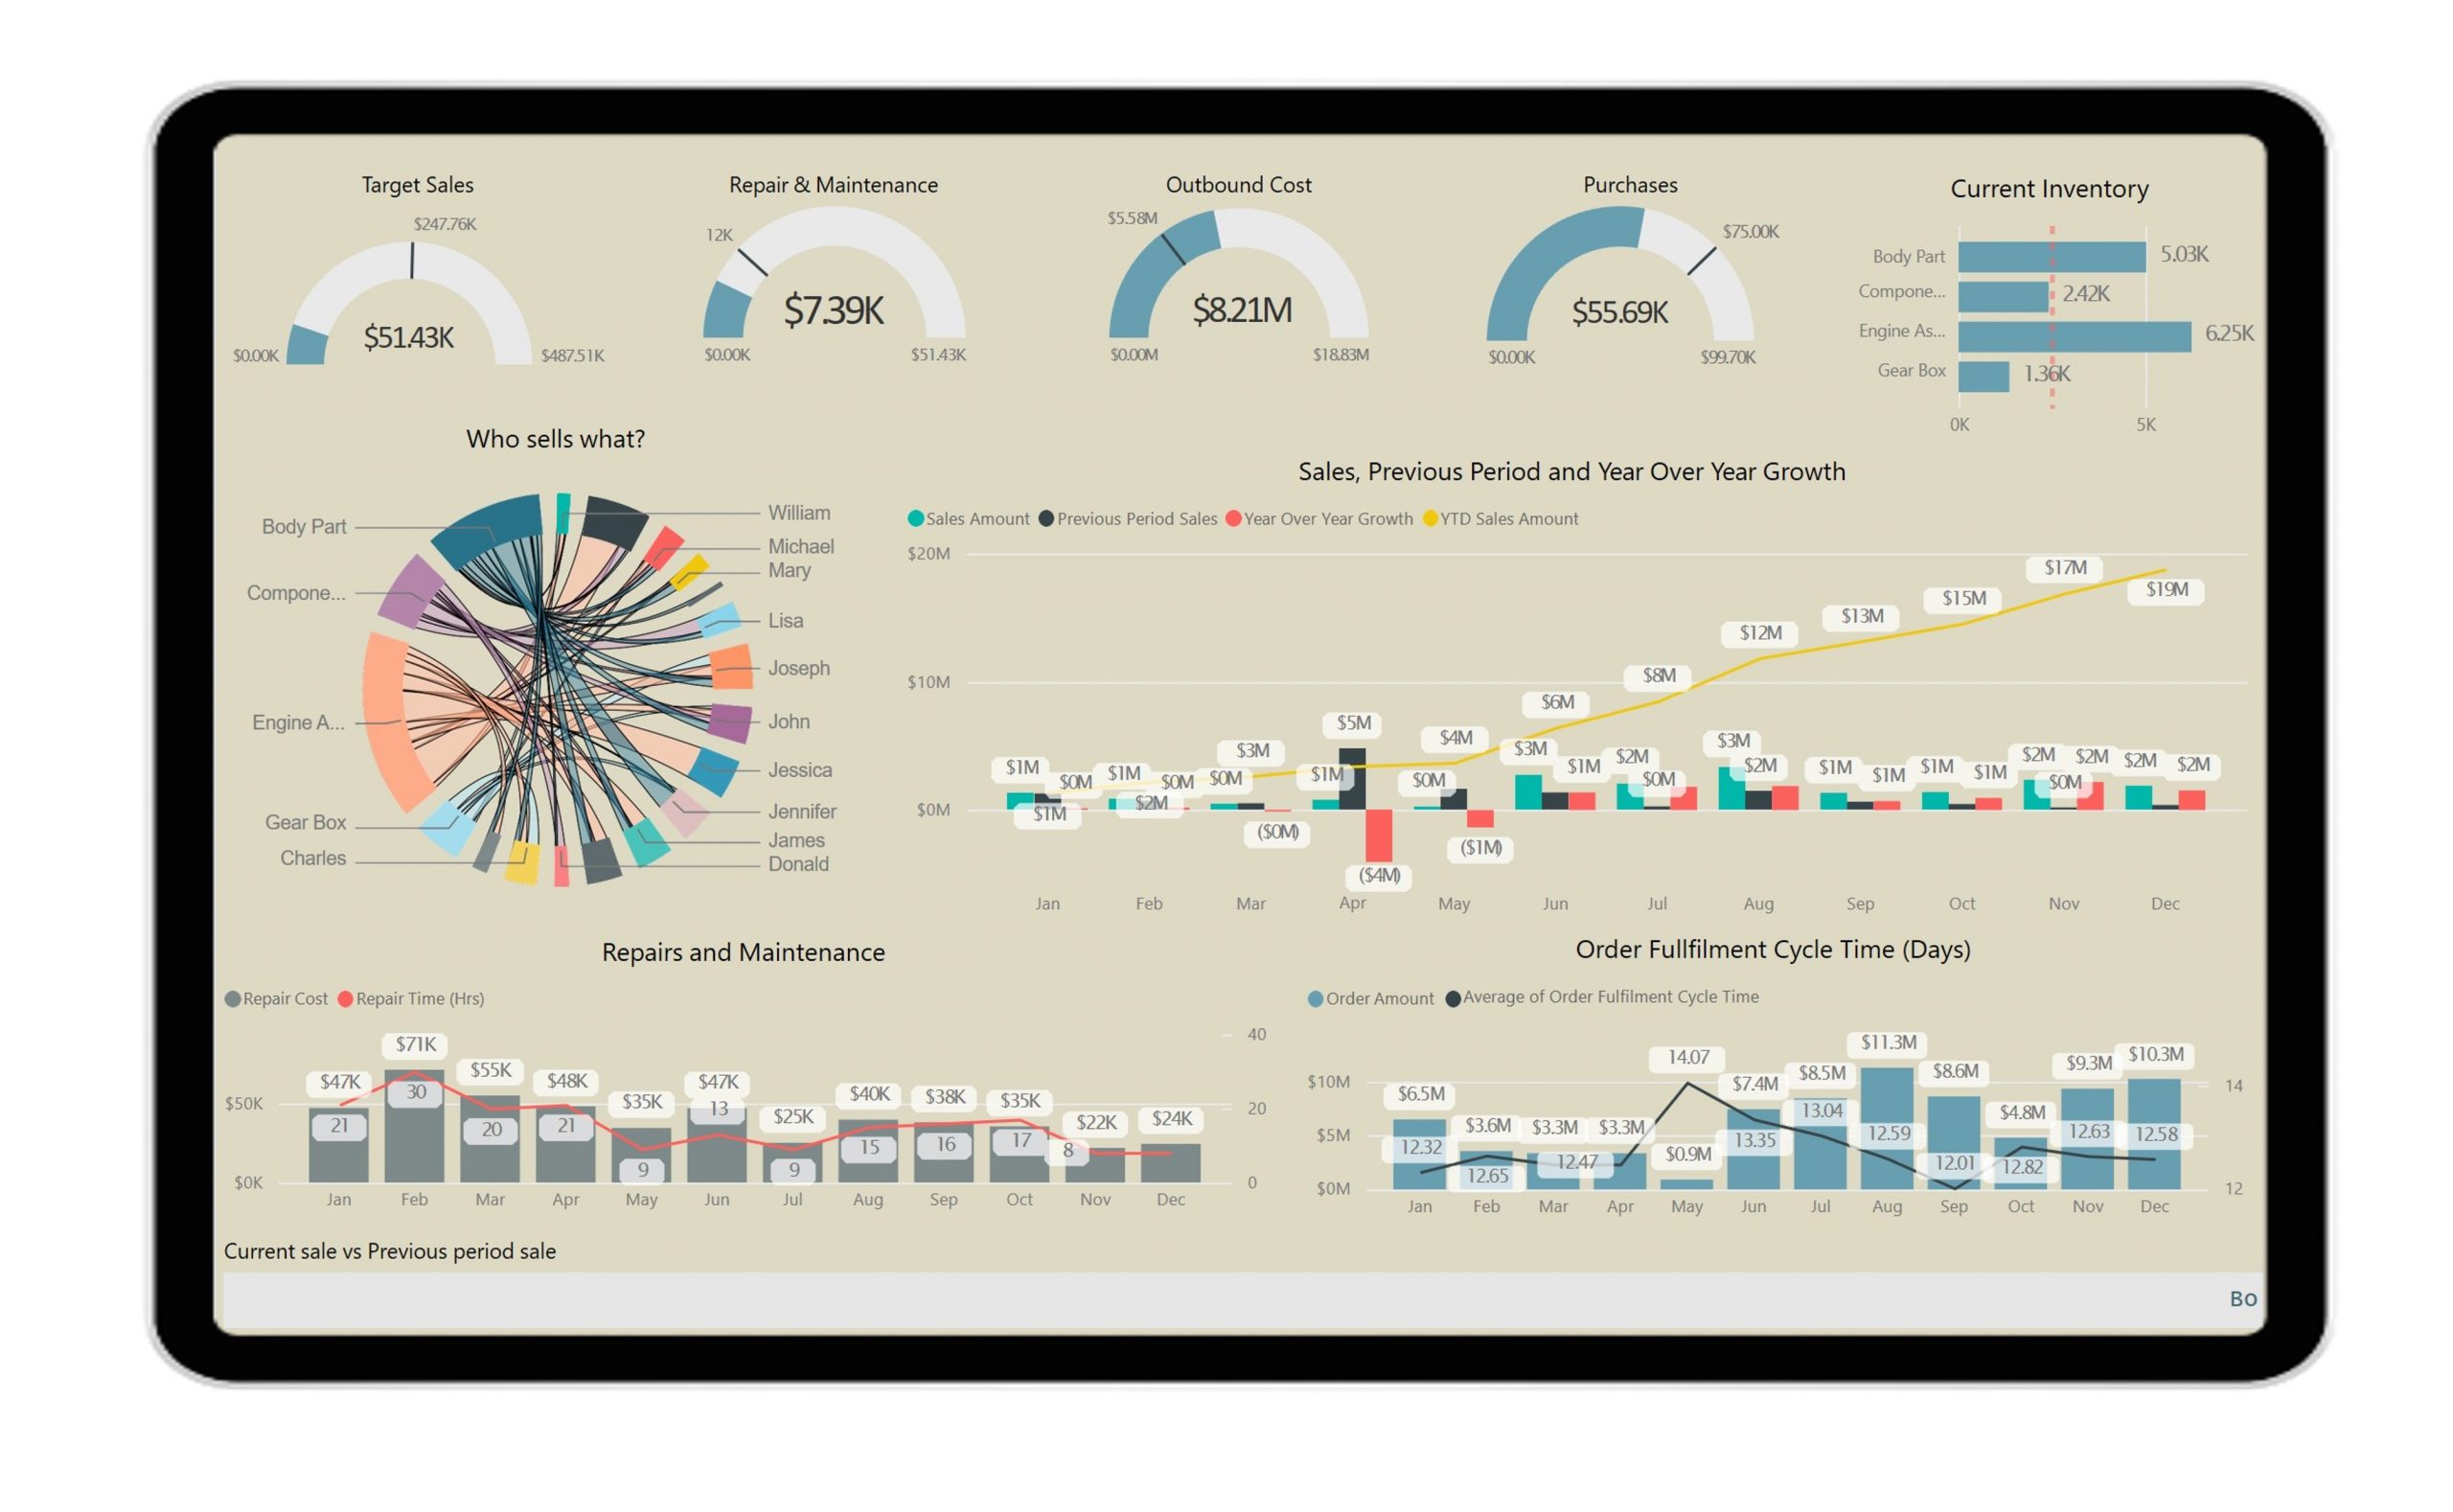
This report is designed to analyze and visualize overall information related to sales for sales leaders and management to improve strategic planning. A variety of KPI’s tracked on the four majors: Sales values, Product categories, Sales executives, and New customers as it is having a major focus to grow these accounts.
 (1)")


Insurance Claim Analytics:
Insurance companies are always known due to their operational excellence. Companies need to achieve the minimum turnaround time, high settlement ratio, Higher claim disbursement amounts to keep their customers happy which will ultimately push existing customers to renew their policies.
There is a lot more to do at the back end to achieve the operational goals and maintain customer satisfaction. This is where Modern Business Intelligence (BI) plays a crucial role in identifying operational gaps, opportunities, and potential risks so that companies can work on the insights.
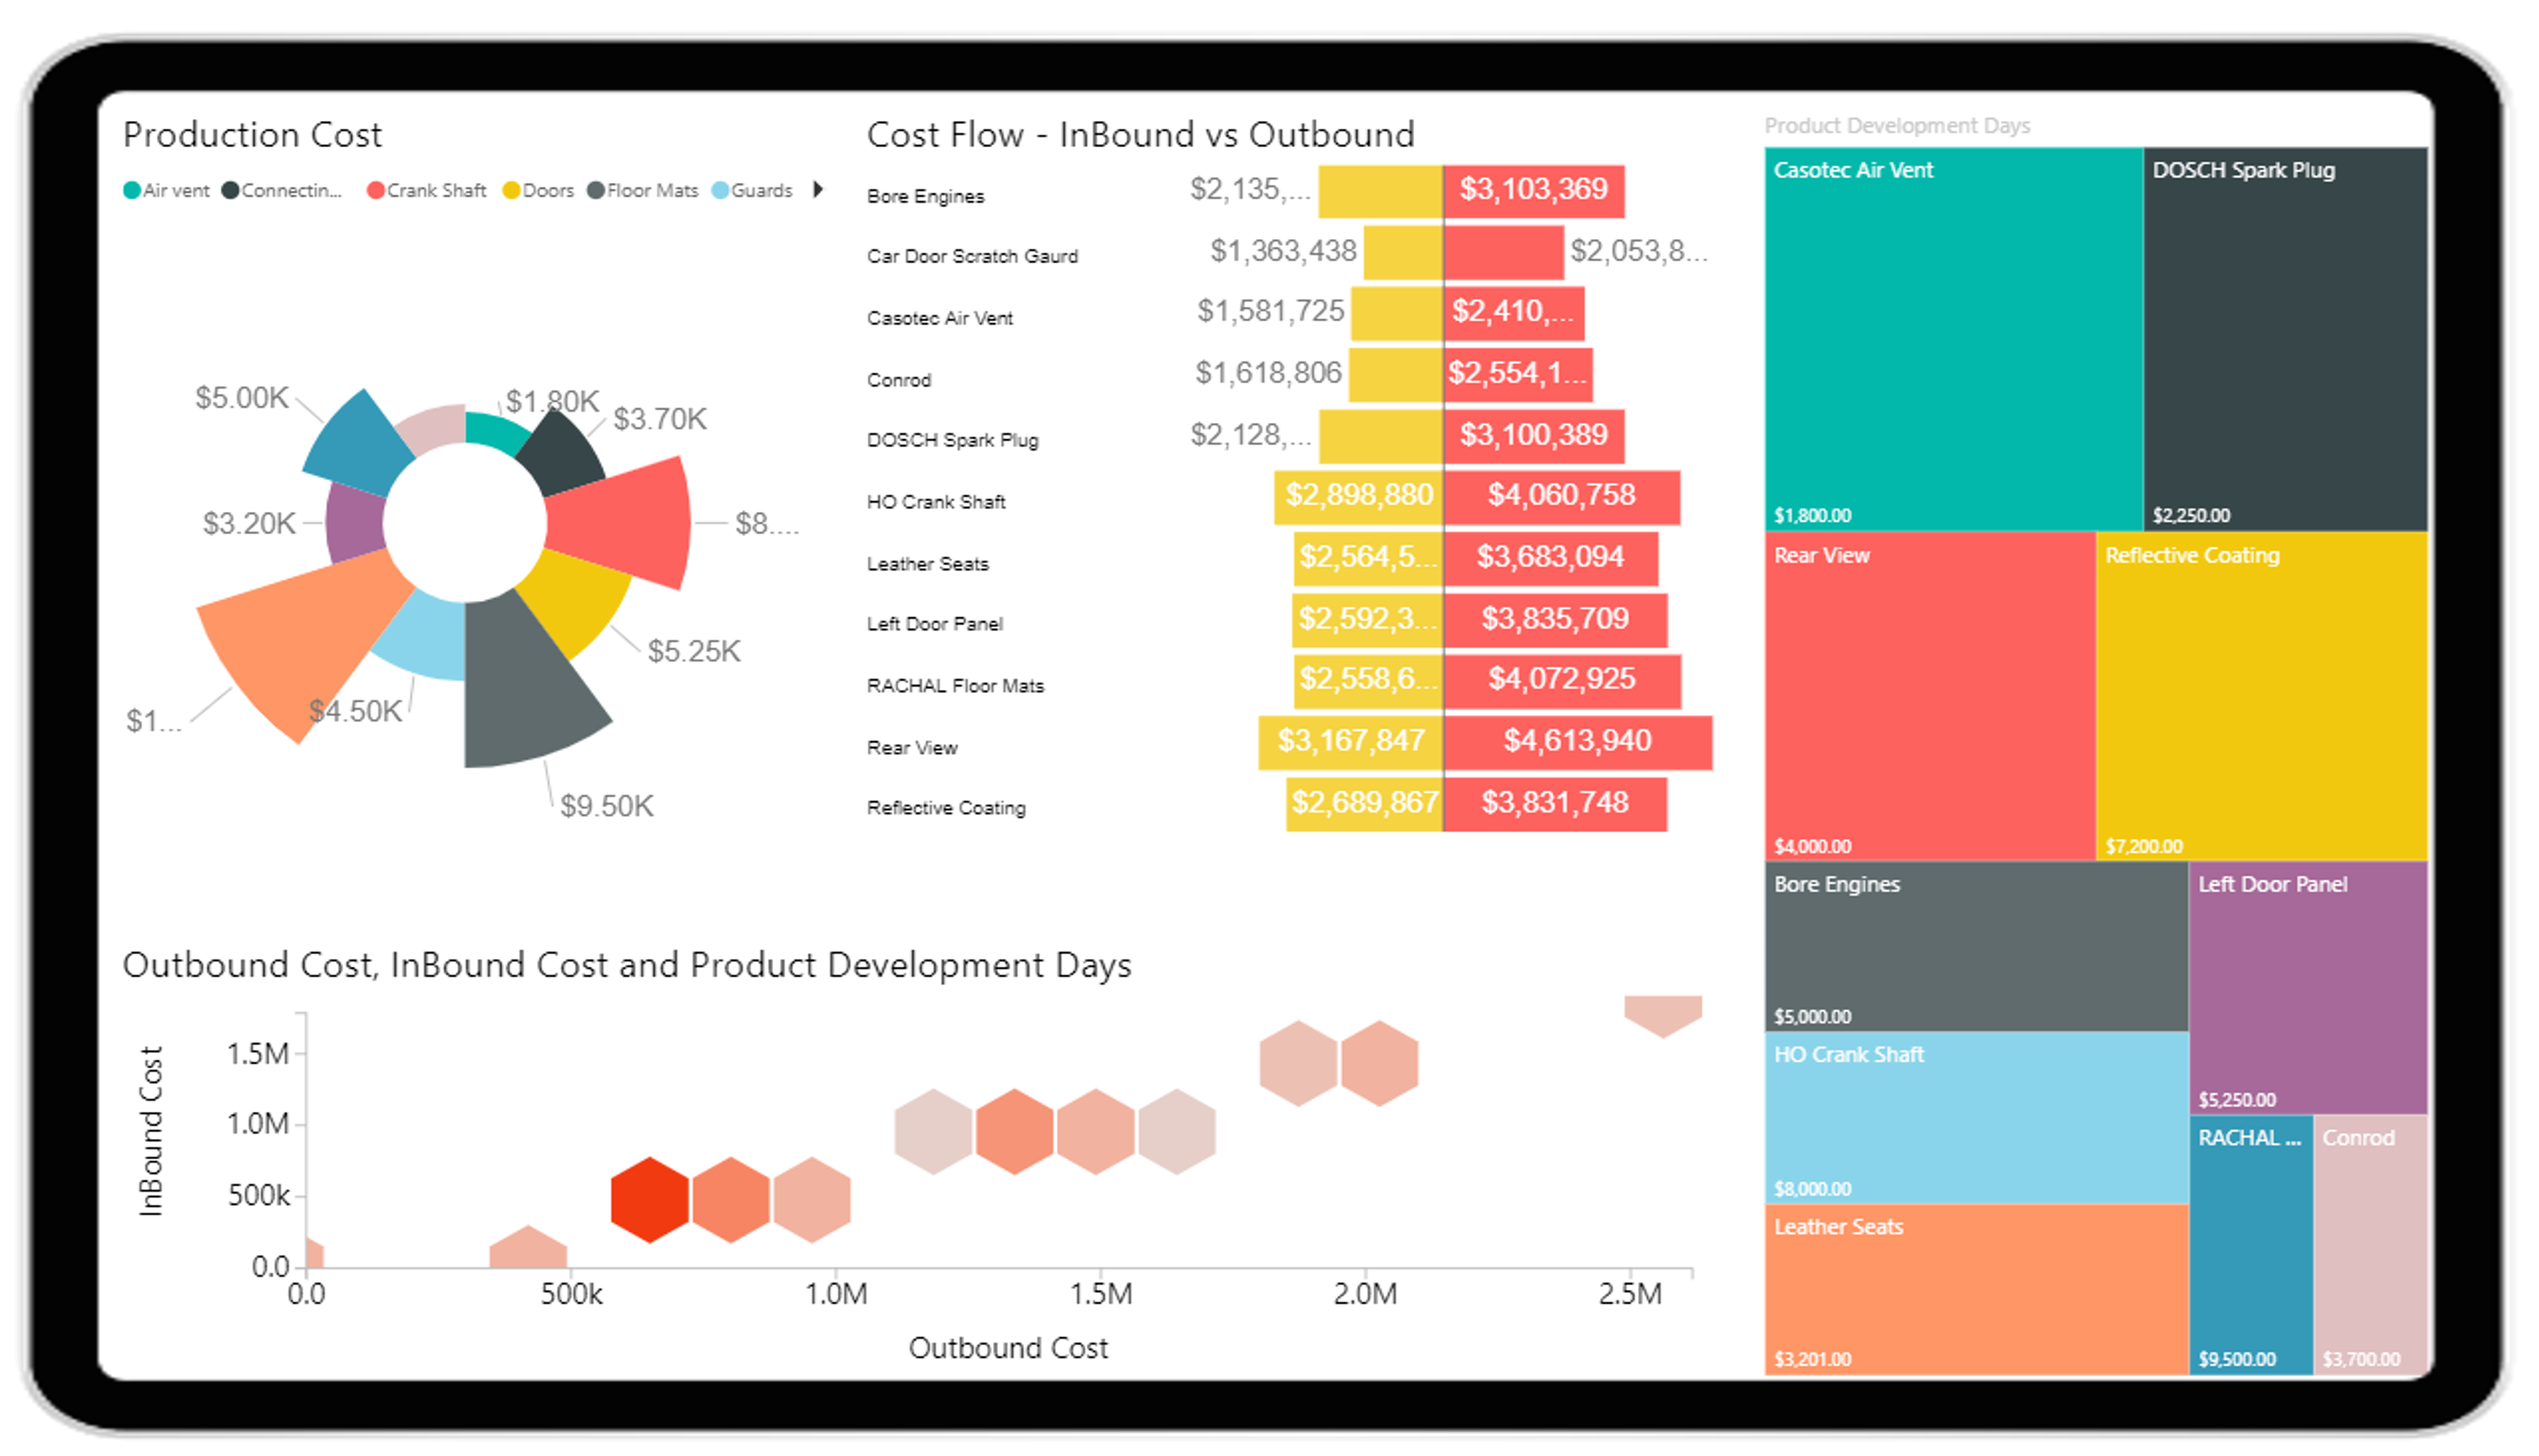
This Power BI dashboard was developed by extracting data from various databases such as CRM, Sales, Financials, and the organizational reports summarized the company’s performance across various locations, insurance verticals, and many other aspects.
Dashboard Highlights:
- Dashboard gives an overview of insurance operations YoY in the very first section. It highlights Total claims notified, total claim amounts current year and previous year, Claim YoY%, Number of claims by different insurance verticals, total claim amounts vs total premium received each month.
- Insurance handling overview highlights the claim settlement status, claim amount vs monthly premium for each month and tracks the overall settlement ratio.
- ‘Insurance distribution by types’ section focuses on the number of claims by different insurance types with YoY comparison. It also shows the number of outliers claims and claims initiated by different channels such as Emails, Phones, through agents, or by courier.
- Regional distribution of claims by different insurance categories helps in understanding city-wise claims initiated, most active claim categories. It helps in sales and operational planning as well.
- Demographical distribution of insurance helps in understanding which age group and gender is reporting a greater number of claims by different insurance categories.
- Understanding claim amount vs monthly premium is important from the profitability perspective. It helps in understanding revenue generated from the existing customers. Also, which region/city is more profitable or causing losses.
- Customers usually prefer cashless claims over reimbursement claims. Insights on the same will help the operations team in understanding if they need to do more hospital/ health care services tie-ups for cashless claims. It will increase customer satisfaction.
Overall, this dashboard can provide an in-depth analysis of Insurance operations for the last five years. It also gives important insights to the sales team for their planning and strategy development.
Explore More Dashboards
CXO Dashboard
Manufacturing Dashboard
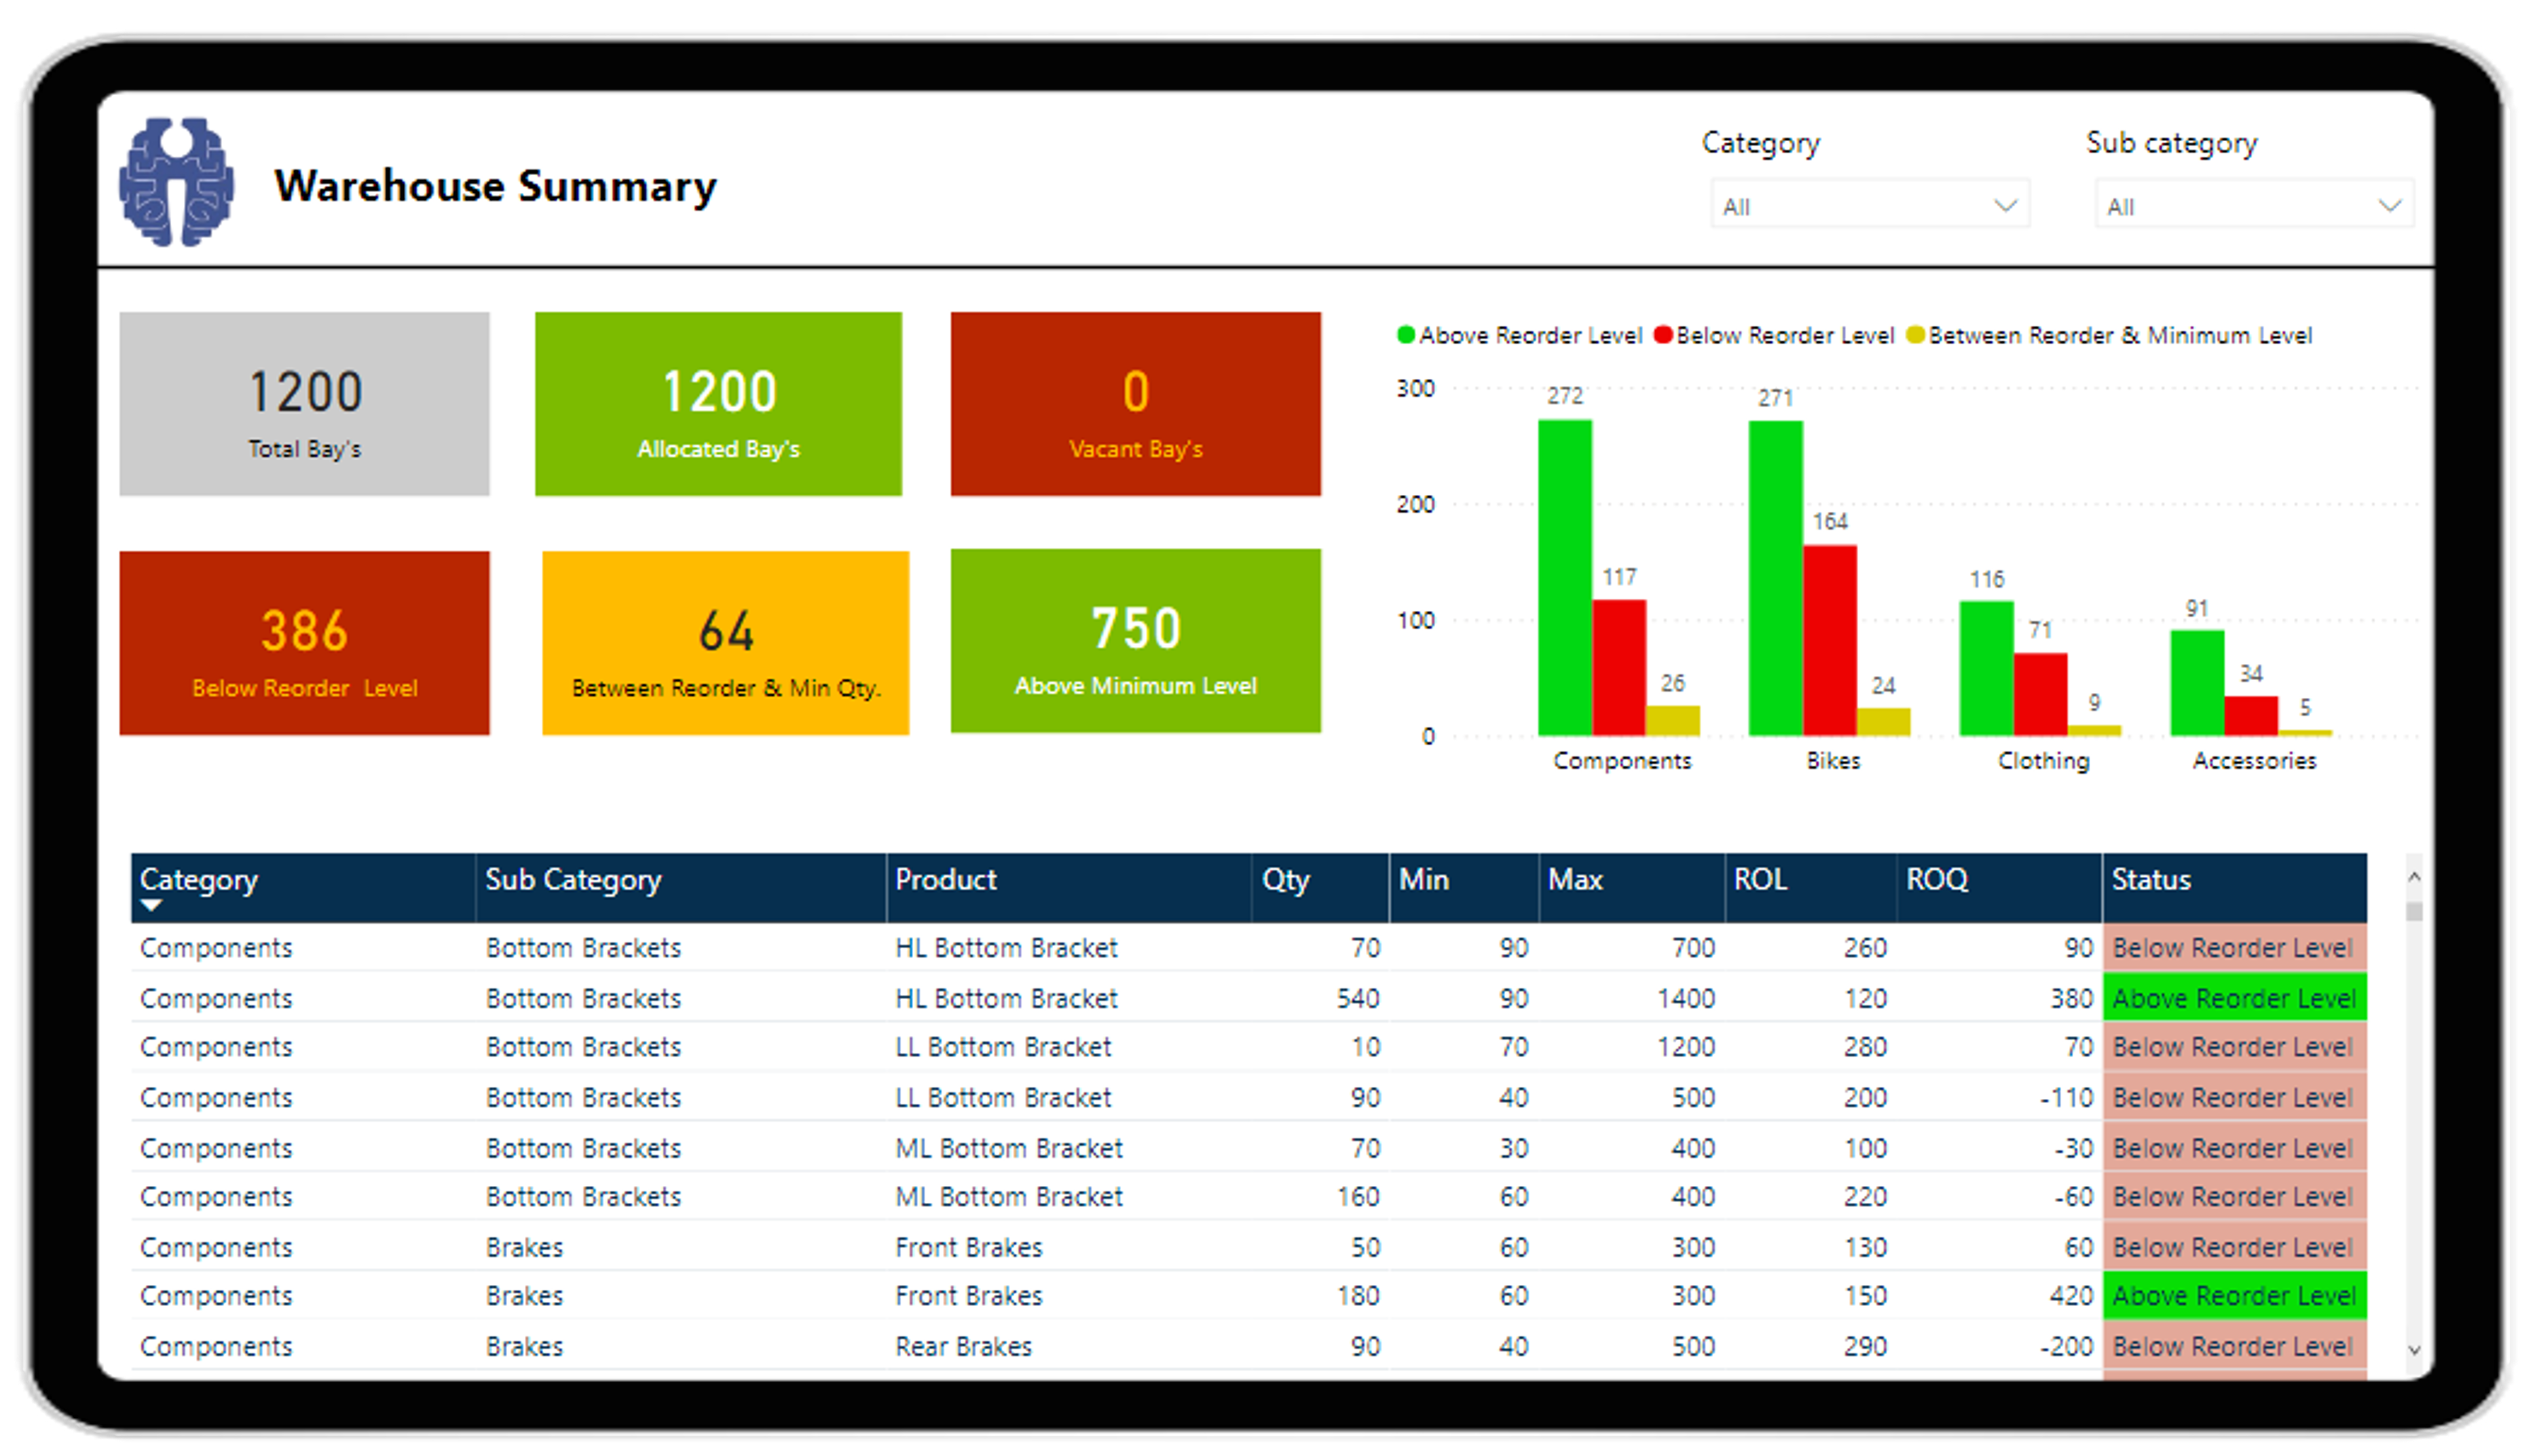
Warehouse Operation Overview
Start your Power BI journey with Intellify Solutions
Book a free demo today